In December 2025, the average home sold for $1,006,735
This is down -5.7% from last year.
Market Updates
Market Updates
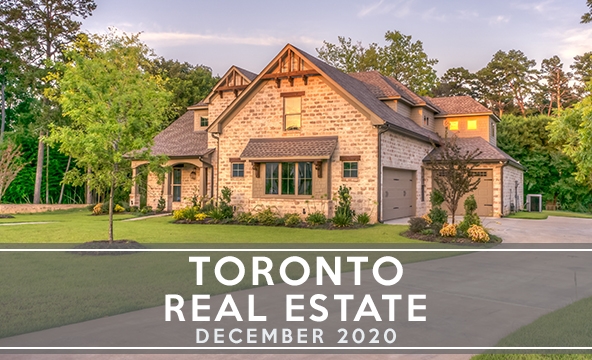
In December 2025, the average home sold for $1,006,735
This is down -5.7% from last year.
by Nicholas Mak
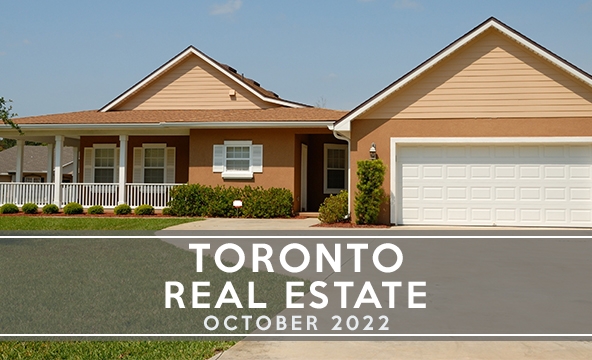
In October 2025, the average home sold for $1,054,372
This is down -7.1% from last year.
by Nicholas Mak
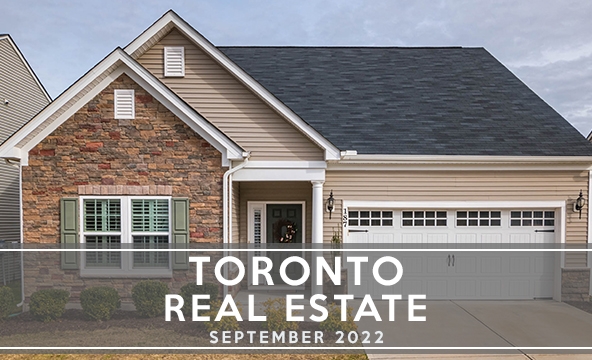
In September 2025, the average home sold for $1,059,377
This is up +3.6% from last month and down -4.3% from last year.
by Nicholas Mak
In May 2025, the average home sold for $1,120,879.
This is up +1.2% from last month and down -3.8% from last year.
There were 6,244 sales in May which is -13.3% lower than in 2024.
by Via Ocampo
In April 2025, the average home sold for $1,107,463.
This is up +1.3% from last month and down -4.2% from last year.
There were 5,601 sales in April which is -23.3% lower than in 2024.
by Lawrence
In March 2025, the average home sold for $1,093,254.
This is up +0.80% from last month and down -2.53% from last year.
There were 5,011 sales in March which is -23.13% lower than in 2024.
by Via Ocampo
In February 2025, the average home sold for $1,084,547.
This is up +4.18% from last month and down -2.18% from last year.
There were 4,037 sales in February which is -27.42% lower than in 2024.
by Via Ocampo
In January 2024, the average home sold for $1,040,994.
This is down -2.45% from last month and up +1.4% from last year.
There were 3,847 sales in January which is -7.90% lower than in 2024.
by Via Ocampo
In December 2024, the average home sold for $1,067,186.
This is down -3.51% from last month and down -5.6% from last year.
There were 3,359 sales in December which is -1.75% lower than in 2023.
by Via Ocampo
In November 2024, the average home sold for $1,106,050.
This is down -2.57% from last month and up +2.2% from last year.
There were 5,875 sales in November which is +40.08% higher than in 2023.
by Via Ocampo
In October 2024, the average home sold for $1,135,215.
This is up +2.52% from last month and up +0.8% from last year.
There were 6,658 sales in October which is +44.39% higher than in 2023.
by Via Ocampo
In September 2024, the average home sold for $1,107,291.
This is up +3.06% from last month and down -1.1% from last year.
There were 4,996 sales in September which is +8.47% higher than in 2023.
by Via Ocampo
In August 2024, the average home sold for $1,074,425.
This is down -2.91% from last month and down -0.7% from last year.
There were 4,975 sales in August which is -5.26% lower than in 2023.
by Via Ocampo
In July 2024, the average home sold for $1,106,617.
This is down -4.78% from last month and down -1.1% from last year.
There were 5,391 sales in July which is 3.28% higher than in 2023.
by Via Ocampo
In June 2024, the average home sold for $1,162,167.
This is down -0.30% from last month and down -1.7% from last year.
There were 6,213 sales in June which is -16.37% lower than in 2023.
by Via Ocampo
In May 2024, the average home sold for $1,165,691.
This is up +0.8% from last month and down -2.5% from last year.
There were 7,013 sales in May which is -21.73% lower than in 2023.
by Via Ocampo
In April 2024, the average home sold for $ 1,156,167 .
This is up +3.1% from last month and up +0.3% from last year.
There were 7,114 sales in April which is -4.98% lower than in 2023.
by Via Ocampo
In March 2024, the average home sold for $1,121,615.
This is up +1.2% from last month and up +1.2% from last year.
There were 6,560 sales in March which is -4.48% lower than in 2023.
by Via Ocampo
In February 2024, the average home sold for $1,108,720.
This is up +8% from last month and up +1.2% from last year.
There were 5,607 sales in February which is +17.94% higher than in 2023.
by Via Ocampo
In January 2024, the average home sold for $1,026,703.
This is down -5.3% from last month and down -1.2% from last year.
There were 4,223 sales in January which is +36.98% higher than in 2023.
by Via Ocampo
In December 2023, the average home sold for $1,084,692.
This is up +0.2% from last month and up +3.2% from last year.
There were 3,444 sales in December which is +11.46% higher than in 2022.
by Via Ocampo
In November 2023, the average home sold for $1,082,179.
This is down -3.9% from last month and up +0.3% from last year.
There were 4,236 sales in November which is -6.01% lower than in 2022.
by Via Ocampo
In October 2023, the average home sold for $1,125,928.
This is up +0.6% from last month and up +3.4% from last year.
There were 4,646 sales in October which is -5.76% lower than in 2022.
by Via Ocampo
In September 2023, the average home sold for $1,119,428 .
This is up +3.41% from last month and up +3.0% from last year.
There were 4,642 sales in September which is -7.14% lower than in 2022.
by Via Ocampo
In August 2023, the average home sold for $1,082,496.
This is down -3.21% from last month and up +0.3% from last year.
There were 5,294 sales in August which is -5.19% lower than in 2022.
by Via Ocampo
In July 2023 2023, the average home sold for $1,118,374.
This is down -5.39% from last month and up +4.06% from last year.
There were 5,250 sales in July which is +7.8% higher than in 2022.
by Via Ocampo
In June 2023, the average home sold for $1,182,120.
This is down -1.2% from last month and up +3.1% from last year.
There were 7,481 sales in June which is +16% higher than in 2022.
by Via Ocampo
In May 2023, the average home sold for $1,196,101.
This is up +3.7% from last month and down -1.4% from last year.
There were 9,012 sales in May which is +25% higher than in 2022.
by Via Ocampo
In April 2023, the average home sold for $1,153,269.
This is up +4.0% from last month and down -8.1% from last year.
There were 7,531 sales in April which is -5% lower than in 2022.
by Via Ocampo
In March 2023, the average home sold for $1,108,606 .
This is up +1.2% from last month and down -14.7% from last year.
There were 6,896 sales in March which is -36% lower than in 2022.
by Lawrence
In February 2023, the average home sold for $1,095,617.
This is up +5.5% from last month and down -17.9% from last year.
There were 4,783 sales in February which is -47% lower than in 2022.
by Lawrence
In January 2023, the average home sold for $1,038,668.
This is down -1.2% from last month and down -16.4% from last year.
There were 3,100 sales in January which is -44.6% lower than in 2021.
by Lawrence
In December 2022, the average home sold for $1,051,216.
This is down -2.6% from last month and down -9.2% from last year.
There were 3,117 sales in November which is -48.1% lower than in 2021.
by Lawrence
The average home sold for $1,079,395 across the GTA, which is a decrease of -7.2% since last year.
by Lawrence
The average home sold for $1,089,428 across the GTA, which is a decrease of -5.7% since last year.
by Lawrence
The average home sold for $1,086,762 across the GTA, which is a decrease of -4.4% from last year.
by Lawrence
The average home sold for $1,079,500 across the GTA, which is an increase of +0.8% since last year.
by Lawrence
The average home sold for $1,074,754 across the GTA, which is an increase of +1.2% since last year.
by Lawrence
The average home sold for $1,146,254 across the GTA, which is an increase of +5.2% since last year.
by Lawrence
The average home sold for $1,212,806 across the GTA, which is an increase of +9.4% since last year.
by Lawrence
The average home sold for $1,254,436 across the GTA, which is an increase of +15.0% since last year.
by Lawrence
The average home sold for $1,299,894 across the GTA, which is an increase of +18.4% since last year.
by Lawrence
The average home sold for $1,334,544 across the GTA, which is an increase of +27.6% since last year.
by Lawrence
With an average price of $1,242,793 across the GTA, there was an increase of +28.4% compared to last year.
by Lawrence
With an average price of $1,155,345 across the GTA, there was an increase of +19.3% compared to last year.
by Lawrence
With an average price of $1,155,345 across the GTA, there was an increase of +19.3% compared to last year.
by Lawrence
With an average price of $1,155,345 across the GTA, there was an increase of +19.3% compared to last year.
by Lawrence
With an average price of $1,070,911 across the GTA, there was an increase of +12.6% compared to last year.
by Lawrence
With an average price of $1,070,911 across the GTA, there was an increase of +12.6% compared to last year.
by Lawrence
With an average price of $1,062,256 across the GTA, there was an increase of +12.6% compared to last year.
by Lawrence
With an average price of $1,089,536 across the GTA, there was an increase of +17.0% compared to last year.
by Lawrence
Last week, I had the pleasure of helping two people find two rental units downtown. I've seen the...
by Lawrence
With an average price of $1,090,992 across the GTA, there was an increase of +32.8% compared to last year.
by Lawrence
As you may have heard, there is a new "Stress Test" that will be taking place on June 1,...
by Lawrence
With an average price of $10,90,992 across the GTA, there was an increase of +32.8% compared to last year.
by Lawrence
With an average price of $1,097,565 across the GTA, there was an increase of +21.6% compared to last year.
by Lawrence
With an average price of $1,045,488 across the GTA, there was an increase of +14.9% compared to last year.
by Lawrence
With an average price of $967,885 across the GTA, there was an increase of +15.3% compared to last year.
by Lawrence
With an average price of $932,222 across the GTA, there was an increase of +11.3% compared to last year.
by Lawrence
The average home in Toronto sold for $955,615, which is up 13.3% up from last year.
The average price is up, but condos are worth -3% less than last year.
by Lawrence
With an average price of $968,318 across the GTA, there was an increase of +13.6% compared to last year.
by Lawrence
With an average price of $960,772 across the GTA, there was an increase of +14.0% compared to last year.
by Lawrence
With an average price of $951,404 across the GTA, there was an increase of +20.0% compared to last year.
by Lawrence
With an average price of $968,318 across the GTA, there was an increase of +13.6% compared to last year.
by Lawrence
With an average price of $930,869 across all types of houses in the GTA, there was an increase of +11.8% compared to last year.
by Lawrence
With an average price of $863,599 across all types of houses in the GTA, there was an increase of -4.3% compared to last year.
by Lawrence
With an average price of $821,392 across all types of houses in the GTA, there was an increase of +0.1% compared to last year.
by Lawrence
March 2020 - Toronto Real Estate Report
by Lawrence
SAARS Outbreak Effects Mississauga Homes Toronto...
by Lawrence
Mississauga Homes Toronto Condos Selling Prices in the Greater...
by Lawrence
Mississauga Homes - Detached Mississauga Homes - All Types Toronto Homes...
by Lawrence
Mississauga Homes - Detached Mississauga Homes - All Types Toronto Homes...
by Lawrence
Mississauga Homes - Detached Mississauga Homes - All Types Toronto Homes...
by Lawrence
Mississauga Homes - Detached Mississauga Homes - All Types Toronto Homes...
by Lawrence
Mississauga Homes - Detached Mississauga Homes - All Types Toronto Homes...
by Lawrence
Greate Toronto Area Toronto Homes - Detached Mississauga...
by Lawrence
Mississauga Homes - Detached Mississauga Homes - All Types Toronto Homes...
by Lawrence
Greate Toronto Area Toronto Homes - Detached Mississauga...
by Lawrence
Greate Toronto Area Toronto Homes - Detached Mississauga...
by Lawrence
Greate Toronto Area Toronto Homes - Detached Mississauga...
by Lawrence
Greate Toronto Area Toronto Homes - Detached Mississauga...
by Lawrence
Greate Toronto Area Toronto Homes - Detached Mississauga...
by Lawrence
Greate Toronto Area Toronto Homes - Detached Mississauga...
by Lawrence
Mississauga Homes - Detached Mississauga Homes - All Types Toronto Homes...
by Lawrence
Mississauga Homes - Detached Mississauga Homes - All Types Toronto Homes...
by Lawrence
Mississauga Homes - Detached Mississauga Homes - All Types Toronto Homes...
by Lawrence
Mississauga Homes - Detached Mississauga Homes - All Types Toronto Homes...
by Lawrence
Mississauga Homes - Detached Mississauga Homes - All Types Toronto Homes...
by Lawrence
Mississauga Homes - Detached Mississauga Homes - All Types Toronto Homes...
by Lawrence
Mississauga Homes - Detached Mississauga Homes - All Types Toronto Homes...
by Lawrence
Mississauga Homes - Detached Mississauga Homes - All Types Toronto Homes...
by Lawrence
Mississauga Homes - Detached Mississauga Homes - All Types Toronto Homes...
by Lawrence
Mississauga Homes - Detached Mississauga Homes - All Types Toronto Homes...
by Lawrence
Mississauga Homes - Detached Mississauga Homes - All Types Toronto Homes...
by Lawrence
Mississauga Homes - Detached Mississauga Homes - All Types Toronto Homes...
by Lawrence
Mississauga Homes - Detached Mississauga Homes - All Types Toronto Homes...
by Lawrence
Mississauga Homes - Detached Mississauga Homes - All Types Toronto Homes...
by Lawrence
Mississauga Homes - Detached Mississauga Homes - All Types Toronto Homes...
by Lawrence
Mississauga Homes - Detached Mississauga Homes - All Types Toronto Homes...
by Lawrence

